At a glance
- Tirzepatide's terminal half-life is about 5 days, which is what supports weekly dosing
- No human pharmacokinetic study reports a measured half-life for BPC-157
- Published ipamorelin half-life data come from rats, not from human PK
- Intravenous thymosin beta-4 half-life rose with dose from 42 mg to 1260 mg
- Plasma half-life and duration of effect are different numbers for secretagogues
Search "peptide half life chart" and the first page of results disagrees with itself. One chart gives BPC-157 a half-life of 4 to 12 hours. Another prints a single confident figure. A third contradicts its own entry for AOD-9604 two rows apart. None of them links a pharmacokinetic study.
The published human record contains no measured half-life for BPC-157 at all. That is the honest answer, and it is the one nobody publishes, because a blank cell looks worse than a number.
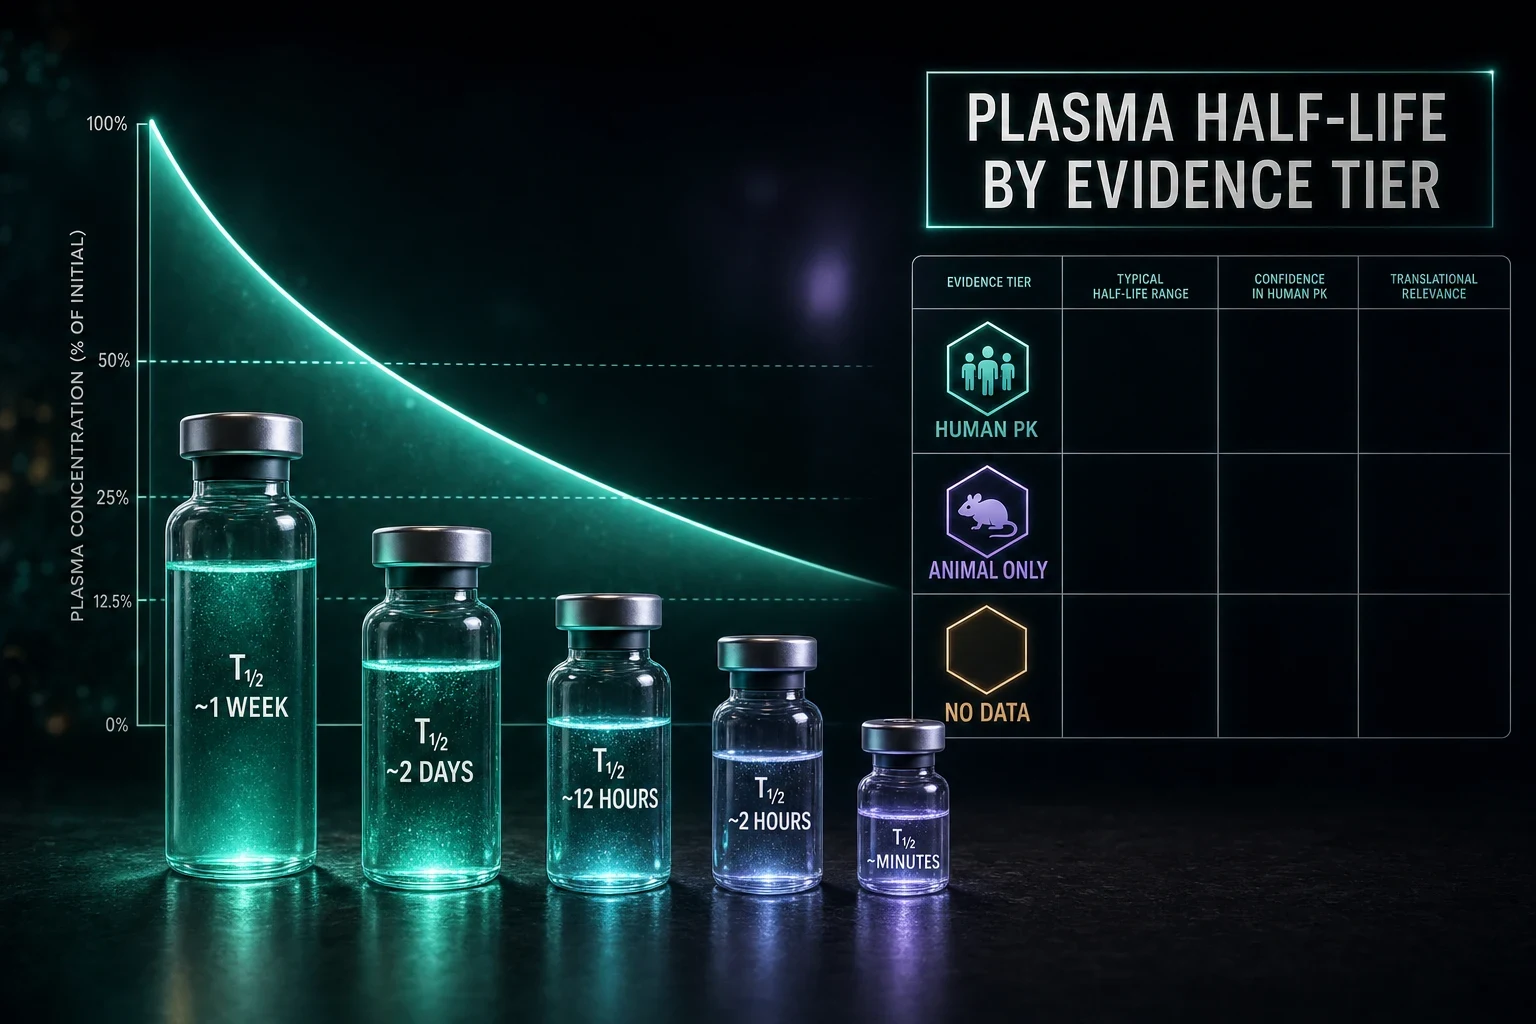
So this chart is built the other way around. Every row is tagged with the kind of evidence behind it: measured human pharmacokinetics, animal PK only, or no PK data. Where a primary study exists, it is linked. Where it does not, the row says so.
What a half-life number actually measures
Half-life is the time plasma concentration takes to fall by half once absorption and distribution have settled. It describes elimination. It does not describe how long a compound does something.
Those two ideas get collapsed constantly on vendor pages. Plasma half-life tracks clearance; duration of effect tracks the downstream biology, which can run shorter or much longer. For growth hormone secretagogues the gap is wide enough that reasoning about dosing interval from half-life alone gives the wrong answer.
There is a further problem with the single-number format. Half-life shifts with route and often with dose. In the phase 1 study of intravenous thymosin beta-4 in healthy volunteers, four cohorts of ten received single doses of 42, 140, 420 or 1260 mg; exposure was dose-proportional and the reported half-life increased with dose (phase 1 intravenous thymosin beta-4 study, 2010). One cell in a table cannot carry that.
Note: A half-life only becomes a usable number once you also know the species, the route, and the dose it was measured at. Charts that omit all three are repeating folklore.
The three evidence tiers behind any peptide half-life number
| Tier | What it means | Weight it deserves |
|---|---|---|
| Human PK | Measured in people, published, with a model and parameter estimates | Usable for reasoning about exposure |
| Animal PK only | Measured in rats, swine or mice; no human study exists | Directional. Interspecies scaling of peptide clearance is unreliable |
| No PK data | No published pharmacokinetic measurement in any species, or none in humans | Not a number. Treat any figure as an estimate of unknown origin |
Most compounds sold as research peptides sit in the bottom two rows. That is the single most useful thing a half-life chart can tell you, and it is the thing every competing chart hides.
Peptide half-life chart with evidence tiers
| Compound | Reported half-life | Route measured | Evidence tier | Primary source |
|---|---|---|---|---|
| Semaglutide | About 1 week in humans; mini-pig plasma half-life 46.1 h IV, mean residence time 63.6 h SC | SC, IV | Human PK (regulatory label) plus preclinical | semaglutide discovery paper, 2015 |
| Tirzepatide | About 5 days terminal; two-compartment model, first-order absorption and elimination | SC | Human population PK | tirzepatide population pharmacokinetics, 2024 |
| Tesamorelin | One-compartment model with first and zero order absorption and linear elimination | SC | Human population PK | tesamorelin population pharmacokinetic analysis |
| GHRH (hGRF-44) | Biexponential decline over minutes across a wide IV dose range | IV | Human PK | growth hormone releasing factor pharmacokinetics in normal men |
| Tabimorelin (NN703) | Two-compartment PK with an indirect-response model; half-maximal GH stimulation at 485 ng/mL | Oral | Human PK/PD | NN703 human PK/PD modeling study |
| Thymosin beta-4 (full length) | Dose-dependent; half-life rose across 42 to 1260 mg | IV | Human PK | phase 1 intravenous thymosin beta-4 study, 2010 |
| Ipamorelin | No human half-life published. In rats, systemic clearance about five-fold lower than GHRP-6, mainly urinary excretion, intranasal bioavailability near 20% | SC, IN (rat) | Animal PK only | ipamorelin nasal absorption pharmacokinetics |
| TB-500 | None published. TB-500 is a fragment, not full-length thymosin beta-4, so the human Tβ4 PK above does not transfer | Not measured | No PK data | See the Tβ4 study above for the distinction |
| BPC-157 | None published in humans. Stable in gastric juice; human PK described as critically undercharacterized | Not measured in humans | No human PK | BPC-157 biopharmaceutical review |
Sort and filter these interactively on our peptide half-life calculator, which carries the same values alongside the per-compound records in the compound library.
Only four of the nine rows rest on human pharmacokinetics of the molecule named in them. Three of the compounds most often sold as research peptides (ipamorelin, TB-500 and BPC-157) have no published human half-life at all.
Why half-life and duration of effect are different numbers
Tesamorelin makes the gap concrete. Its population PK fits a one-compartment model with linear elimination, and age, body size, race and health status did not predict exposure in the analysed population (tesamorelin population pharmacokinetic analysis). A separate PK/PD analysis modelled the downstream response and treated the drug as stimulating growth hormone secretion in an episodic manner, predicting multi-dose GH and IGF-1 time courses from exposure (tesamorelin PK/PD analysis).
Read those two papers together and the point lands: the peptide clears on one timescale, the GH pulse it triggers runs on another, and IGF-1 moves on a third. Picking a dosing interval off the first number ignores the two that carry the biology.
Tolerance complicates it further. The oral secretagogue NN703 was modelled in human volunteers with an indirect-response model that included tolerance, with half-maximal GH stimulation at 485 ng/mL, and the tolerance effect reappeared with multiple dosing (NN703 human PK/PD modeling study). A compound can sit in plasma at an active concentration while the response to it fades.
Bottom line: For the GH secretagogue and GHRH-analog classes, plasma half-life is close to useless as a dosing-interval input. The published GH and IGF-1 response curves are the relevant data, and they are not what charts print.
Where the published record is simply silent
BPC-157 is the clearest case. Reviews of its development describe the pentadecapeptide (15 amino acids, roughly 1419 Da) as unusually stable in gastric juice, and attribute that partly to a residue set lacking methionine, cysteine, asparagine and glutamine. The same literature states plainly that human pharmacokinetics are critically undercharacterized (BPC-157 biopharmaceutical review). Stability in gastric juice is not a half-life, and oral activity in rodents is not a bioavailability measurement.
TB-500 fails a different way. The human intravenous data belong to full-length thymosin beta-4, not to the fragment sold under the TB-500 name, so quoting the Tβ4 half-life on a TB-500 row is a category error rather than a rounding error. Our TB-500 compound page and BPC-157 page both flag which claims rest on human data and which do not.
Ipamorelin sits in between. Rat work reports systemic clearance roughly five-fold lower than GHRP-6 with mainly urinary excretion and intranasal bioavailability near 20% (ipamorelin nasal absorption pharmacokinetics), and the original characterisation showed GH-release selectivity in swine without raising ACTH or cortisol beyond GHRH-stimulated levels (ipamorelin selectivity study, 1998). Humans have received it: a randomised placebo-controlled proof-of-concept trial infused 0.03 mg/kg intravenously twice daily after bowel resection and found no significant difference from placebo on the efficacy endpoints, with treatment-emergent adverse events in 87.5% of the ipamorelin arm and 94.8% of placebo (ipamorelin postoperative ileus trial, 2014). That trial establishes human exposure and tolerability. It does not publish a half-life, which is why the ipamorelin page cites rat kinetics and labels them as such.
The broader caution applies to the whole secretagogue class. A review of growth hormone secretagogue safety and efficacy concluded that few long-term, rigorously controlled human studies exist and that long-term safety, including cancer incidence and mortality, still needs evaluation (growth hormone secretagogue safety review, 2018).
What half-life does legitimately tell you
Three things, and only for compounds where it was measured in humans.
Time to steady state. Standard pharmacokinetics puts steady state at roughly four to five half-lives of repeated dosing at a fixed interval. For tirzepatide at about 5 days, weekly dosing reaches steady state inside roughly a month, which is consistent with the published population model (tirzepatide population pharmacokinetics, 2024) and with the escalation steps on the tirzepatide dosage chart.
Accumulation on a weekly schedule. Semaglutide's roughly one-week human half-life is the reason a weekly injection holds concentrations in a usable band rather than spiking and vanishing. The molecule was engineered for it: two substitutions against native GLP-1 plus derivatisation at lysine 26 to raise albumin affinity and resist enzymatic breakdown, with a measured mini-pig plasma half-life of 46.1 hours after IV dosing and a 63.6-hour mean residence time after subcutaneous dosing (semaglutide discovery paper, 2015). Native GLP-1 clears in minutes. The engineering is the half-life.
Washout. Four to five half-lives is also the rough window for clearance after stopping, which is the number that matters when switching compounds. Our GLP-1 dosing comparison works through that for the incretin class, and the dosage chart library carries the per-compound schedules alongside the half-life fields.
Warning: None of the above converts an animal half-life into a human dosing interval. Peptide clearance does not scale reliably across species, which is precisely why the animal-PK-only rows in the chart stay flagged rather than being quietly promoted.
How to read a vendor's half-life claim
Four questions sort honest reference data from copy-paste.
- Does it cite a study? Not a review of a review. A primary pharmacokinetic paper with a PMID.
- Which species? If the number came from rats and the page does not say so, the page is not being careful with anything else either.
- Which route and dose? The thymosin beta-4 data show half-life moving with dose inside a single study.
- Is the compound the one that was measured? Fragments, acetate salts and PEGylated variants are different molecules with different clearance.
A vendor that cannot answer those about a half-life generally cannot answer harder questions about identity and purity either. That is why we keep a third-party COA library with the actual assay documents rather than restating vendor claims, and why our vendor audits check documentation rather than marketing copy. If you want to see what the standard looks like applied end to end, the Ascension Peptides review walks through sourcing, COA availability and what the paperwork does and does not prove. Ascension is where we route research-peptide sourcing, and code ENHANCED takes 50% off, with the caveat this whole article argues: a COA tells you what is in the vial, not how long it stays in circulation. For most of the compounds above, nobody has measured the second thing.
For research planning, concentration maths matters more than half-life folklore anyway. Our reconstitution calculator handles the vial-to-syringe arithmetic, and the half-life tool models accumulation across repeated doses using the values in the chart above.
Tip: When a chart and a primary paper disagree, the paper wins. When no paper exists, the correct entry is "not measured", not a plausible-looking range.
Research peptides are sold for laboratory research use only. Nothing above is medical advice, a dosing recommendation, or a claim of clinical efficacy; several compounds discussed here have no human pharmacokinetic characterisation at all, and some are listed by FDA among bulk drug substances that may present significant safety risks for compounding. Consult a qualified clinician before making any health decision.